Eliott Waves
Basic concepts of Elliot Waves


Elliot Waves
What are Elliot Waves?
Elliott Waves analysis is a method of technical analysis that attempts to identify recurring patterns in financial markets. These patterns are based on the idea that market movements are not random, but rather follow a certain structure and rhythm.
The theory was developed by Ralph Nelson Elliott in the 1930s, According to Elliott, markets move in a series of five waves in the direction of the main trend, followed by a corrective three-wave pattern.
The five-wave pattern is known as the impulse wave, and it represents the main trend of the market. The three-wave pattern is known as the corrective wave, and it represents a temporary countertrend movement.
The Elliott Waves analysis is based on the idea that the market moves in waves of different degrees. These waves can be identified using various technical indicators and tools, such as trend lines, moving averages, and Fibonacci retracements.
The Elliott Waves analysis can be used to identify potential entry and exit points for trades, as well as to determine the overall trend of the market. It can also be used to set stop-loss orders and to manage risk.
However, it is important to note that the Elliott Waves analysis is not a foolproof method of trading. It requires a deep understanding of technical analysis and market dynamics, as well as a certain degree of intuition and experience.
So, how do the Elliott Waves work?
According to the theory, the market moves in a series of five waves in the direction of the main trend, followed by a corrective three-wave pattern. The five-wave pattern is known as the impulse wave and represents the main trend of the market, while the three-wave pattern is known as the corrective wave and represents a temporary countertrend movement.
How trade using Elliott Waves,?
Traders need to identify the waves using technical indicators and tools such as trend lines, moving averages, and Fibonacci retracements. Once the waves have been identified, traders can use them to determine potential entry and exit points for trades, set stop-loss orders, and manage risk.
The number of waves in the Elliott Waves theory is eight in total. These waves are made up of the impulse wave, which consists of waves one through five, and the corrective wave, which consists of waves A, B, and C.
To sum it up, the Elliott Waves theory is a powerful tool for cryptocurrency traders looking to identify potential trading opportunities and manage risk. However, traders need to have a deep understanding of technical analysis and market dynamics to use this strategy effectively. As always, traders should exercise caution and never risk more than they can afford to lose.
How to Recognize?
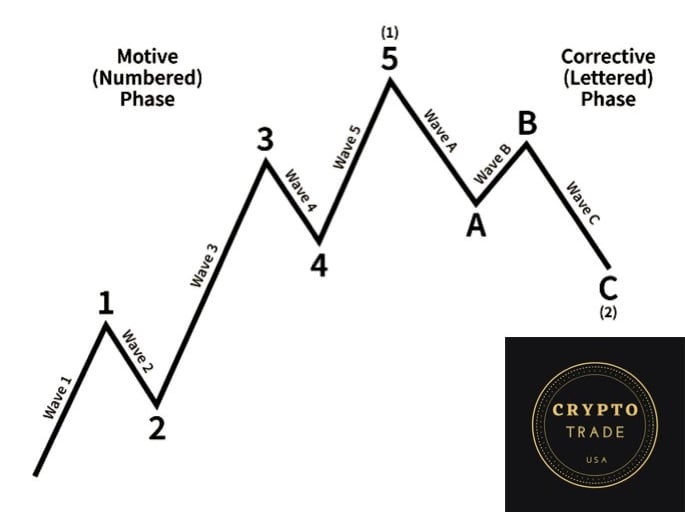
Following a tendency (up or down) we will have Motive phase and corrective phase
Motive Wave
The first half of an idealized Elliott Wave pattern is the Motive Wave, a wave that always advances in the direction of the trend of one larger degree. It is subdivided into five smaller waves, which are labeled 1, 2, 3, 4 and 5, as illustrated in the above chart. Within the motive wave, there are two types of smaller sub-waves: the Impulse Wave and the Diagonal Wave. Each will be explained next
You will notice in the chart that three of these sub-waves advance (waves 1, 3 and 5) and two of them correct or move downward (2 and 4). Waves 1, 3 and 5 in the motive wave are called “actionary” sub-waves. These are usually motive waves themselves, in that they move in the same direction as the trend of one larger degree. Waves 2 and 4 are “corrective” sub-waves, moving in the opposite direction of the larger trend. The motive wave tends to move with relative ease in the direction of the larger trend. Consequently, it is easy to spot and interpret.
There are three rules for Motive Wave formation that must be satisfied:
Wave 2 always retraces (gives back) less than 100% of Wave 1.
Wave 4 always retraces less than 100% of Wave 3.
Wave 3 always travels beyond the end of Wave 1 and is the longest wave.
Corrective Waves
In general, the corrective wave is depicted as a three-wave structure, as seen in the chart above. The three-wave structure has its sub-waves labeled as waves A, B and C. This can be misleading since not all corrective waves are exactly three-wave structures. The specifics of corrective wave structures will be discussed later, but for our general purpose, we will start with describing them as having three sub-waves.
If we look at the structure, we will notice that Wave A and Wave C are both in the direction of the trend of one higher degree - in this case, the direction of the correction. Because of this (for this general example) we will show them as motive waves, each having a total of five waves. Wave B is traveling against the direction of the larger correction (trend of one higher degree) and will therefore be shown as having three waves. This type of pattern is labeled as a 5-3-5 structure.
That pattern could repeat after the cycle
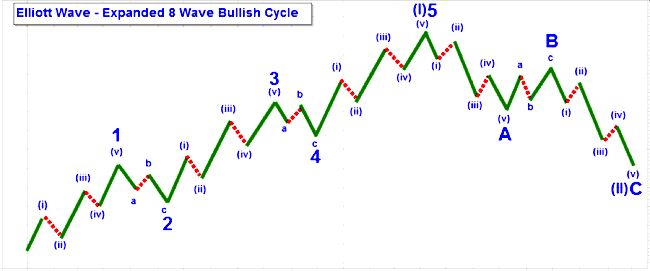
Fractal Nature
If we incorporate an expanded motive and corrective waves together, we will see that they make a more detailed general Elliott structure. We can see five advancing waves in the motive wave that make up Wave I, as well as three declining waves in the corrective wave that make up Wave II. However, notice that in Waves 1 and 2 of Wave I, the general Elliott structure forms. This structure forms on both a larger scale and a smaller scale within the same picture.
This is an example of the fractal nature of the Elliott Wave patterns. A fractal is a curve or geometric figure, each part of which has the same statistical character as the whole, and anything that resembles this type of formation is said to be fractal. Within the Elliott Wave structure, this is evidenced by the expanding and contracting similarity of wave structures. Wave I is the next higher degree of trend for Wave 1, but within Wave 1 and 2 is the 5-3 pattern of the full Elliott Wave cycle. The 5-3 pattern then repeats for Waves 3 and 4, and for waves A and B as well (except in the declining direction).
There are actually three degrees of trend shown in the chart above. Waves I and II form the larger degree cycle. The next degree down are the waves that are labeled 1, 2, 3, 4, 5, A, B, and C. And the next degree down are the waves labeled i, ii, iii, iv, v, a, b, and c. In theory, this pattern expands to infinity and shrinks to infinity and constitutes what is known as a fractal, an infinitely contracting and expanding pattern.
Elliott discovered, by observation, that the markets were fractal in nature. No matter how big or small the wave degree, motive waves take on a 5-wave sequence and corrective waves usually take on a 3-wave sequence. He classified patterns that showed up in higher degrees of trend and saw that those same types of patterns repeated on lower degrees of trends.
The chart above shows the same picture in a declining market. See if you can spot the different degrees of trend.
Elliott Wave is not a trading technique. There are no specific rules of entry or exit, nor is there one “right” way to use it in trading. As a result, the use of Elliott Wave has been avoided by many traders and technical analysts, not due to a lack of understanding but because of the apparently subjective nature of how it may be applied. Nonetheless, there are those who have successfully used Elliott Wave patterns in their trading. The Theory continues to attract a wide following, both with individual investors as well as professional traders. Advocates tend to apply various indicators to help them in trading specific Elliott Wave patterns, although those techniques are unique to the people who developed them.
If you are going to perform Elliott Wave analysis, you will be making “wave-counts.” This simply means that you will be labeling the waves to see how they conform to the Elliott Wave pattern, allowing you to anticipate market movement.
If you want to start your journey you can join our private channel